 BTC
BTC  ETH
ETH  USDT
USDT  BNB
BNB  XRP
XRP  USDC
USDC  SOL
SOL  TRX
TRX  ZEC
ZEC  FIGR_HELOC
  HYPE
HYPE  DOGE
DOGE  XMR
XMR  WBT
WBT 
Bitcoin Price Today: BTC Nears $86K Liquidity Zone as On-Chain Demand Strengthens
Bitcoin has recovered toward the $81,000 area after briefly losing key support, with on-chain data pointing to improving profitability and a derivatives market that could amplify volatility near higher resistance levels.


The latest Bitcoin price action comes as Glassnode’s entity-adjusted Spent Output Profit Ratio (SOPR) moves back above 1.0. At the same time, Bitcoin’s network hashrate has resumed an upward trend, while futures data shows a concentration of short positions between $83,000 and $86,000.
Together, these indicators provide a mixed but improving picture of market structure as BTC approaches an important resistance zone.
BTC Reclaims Ground After Failed Breakdown
Bitcoin recently recovered after falling below the $76,000 area, producing what veteran trader Peter Brandt identified as a potential bear trap.
Brandt described the sequence as a “spring board,” referring to a failed breakdown that is followed by a sharp recovery. His September 18 chart showed BTC rebounding toward $81,100 after the earlier decline.

The pattern is notable because a failed move below established support can leave short sellers positioned for further downside while buyers regain control. However, the chart formation itself does not confirm a sustained rally and remains dependent on subsequent price action.
With BTC now trading around $81,000, the market has moved back above several short- and medium-term technical levels.
SOPR Signals Improving Bitcoin Demand
On-chain conditions have also improved. Glassnode’s entity-adjusted SOPR has climbed above the 1.0 threshold, a level that separates aggregate realized profits from realized losses.
A reading above 1 means Bitcoin holders are, on average, spending coins at a profit. When the measure remains above this level, it indicates that profitable spending is being absorbed without immediately forcing the market back into a broader decline.

Glassnode has associated sustained SOPR readings above 1 with bull-market conditions. Conversely, a return below the threshold would suggest that selling pressure is becoming more difficult for demand to absorb.
The current reading is therefore relevant to Bitcoin price today, particularly because BTC has maintained its recovery while the profitability measure has moved back into positive territory.
Short Positions Build Above $83K
Derivatives positioning could become increasingly important if Bitcoin continues higher.
Glassnode’s futures liquidation heatmap shows a substantial concentration of short liquidation levels between approximately $83,000 and $86,000. BTC is currently trading below this area, leaving a relatively defined zone where leveraged short positions could come under pressure.
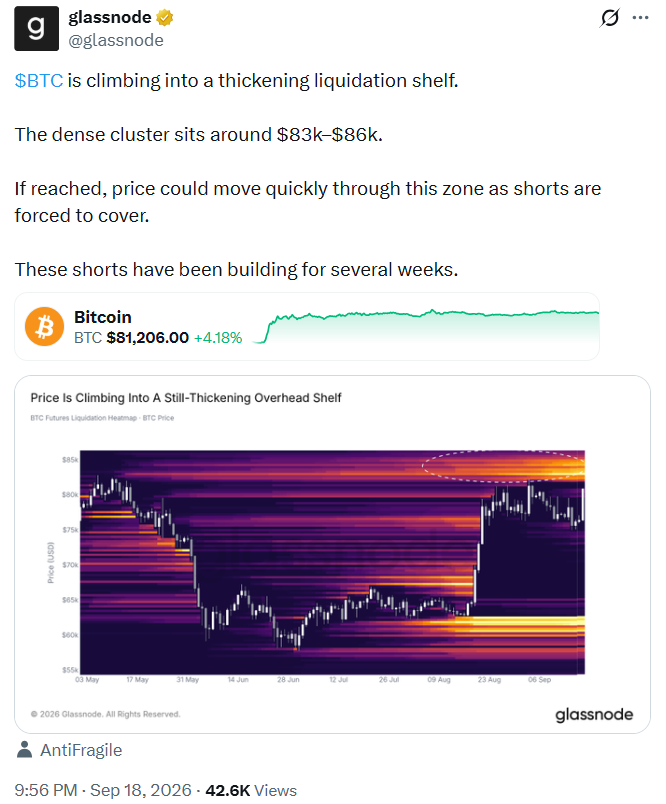
If the market reaches these levels, forced position closures could add buying pressure. This is the mechanism behind a short squeeze, where rising prices force bearish traders to close positions, potentially accelerating the move.
However, liquidation clusters should not be interpreted as guaranteed upside targets. They identify areas where leveraged positions may be vulnerable, while actual price behavior depends on liquidity, spot demand, and broader market conditions.
The same $83,000-$86,000 region also contains a significant concentration of Bitcoin acquired by long-term holders, according to Glassnode. That means the area could present both potential short-covering demand and additional supply from investors looking to realize gains.
Technical Indicators Keep BTC Above Key Averages
TradingView’s daily technical readings show a more nuanced picture.
The overall technical rating remains neutral because oscillators are mixed. The RSI is around 64, indicating positive momentum without reaching the conventional 70 threshold associated with overbought conditions. The Stochastic indicator is also below extreme territory.
Several momentum measures are positive, including the Awesome Oscillator and Momentum indicator. However, the MACD carries a sell signal, providing a counterweight to the broader momentum picture.
Moving averages tell a different story. TradingView shows buy signals across the major short- and long-term averages, with BTC trading comfortably above its 50-day and 200-day averages.
The 50-day EMA is positioned around $74,242, while the 200-day EMA is near $73,278. This leaves the current BTC price substantially above those longer-term trend references.
The divergence between the moving averages and oscillators suggests that the broader trend structure remains constructive while shorter-term momentum requires further confirmation.
$82K Becomes the Immediate Technical Test
Several pivot systems identify the low-$80,000 area as an important short-term resistance region.
Fibonacci pivots place an initial resistance level around $81,430, followed by approximately $85,970. Camarilla calculations show resistance near $82,098 and $83,862.

These levels overlap with the lower portion of Glassnode’s liquidation zone, creating a relatively concentrated technical area above the current market.
On the support side, Camarilla levels identify approximately $76,808 and $75,044, while several moving averages also sit within the broader upper-$70,000 range.
As a result, the market is currently positioned between a well-defined support cluster below and a significant liquidity and supply zone above.
Bitcoin Hashrate Recovers
Network activity provides another piece of the picture.
CryptoQuant’s latest data shows Bitcoin’s true hashrate recovering after a recent decline. Hashrate represents the computational power being used to process and secure the network.

An increase generally means more mining capacity is participating in the network. It can also indicate greater competition among miners, potentially raising the cost of producing new Bitcoin.
Hashrate is not a direct short-term indicator for the price of Bitcoin, as mining conditions are influenced by several variables, including BTC prices, electricity costs, mining efficiency, and network difficulty.
Nevertheless, the renewed rise provides additional evidence that Bitcoin’s underlying network activity remains strong.
What the Current Bitcoin Setup Shows
The latest market structure contains several signals pointing in the same general direction, but they should be considered separately.
Bitcoin has recovered from its failed move below $76,000. Glassnode’s SOPR has returned above 1, suggesting profitable spending is being absorbed without an immediate market rollover. Meanwhile, Bitcoin’s hashrate has resumed its upward trend.
The main unresolved issue is the resistance above the current market.
The $83,000-$86,000 area combines short liquidation levels with a sizeable concentration of previously acquired Bitcoin. A sustained move into that region could therefore produce heightened volatility as traders react to both derivatives positioning and spot-market supply.
A rejection would instead leave the upper-$70,000 region as an important area to monitor. A loss of that support cluster would weaken the current recovery structure and place greater emphasis on whether Bitcoin can establish another base.
For now, the data shows Bitcoin approaching a technically important area with improving on-chain profitability but without a uniform signal across all indicators. The next significant development will likely come from how BTC behaves around the $82,000-$86,000 resistance band rather than from any single Bitcoin price prediction.

Jack Spencer is a financial journalist and crypto market analyst covering digital assets, blockchain innovation, and global market developments. His reporting focuses on cryptocurrency price trends, regulation, institutional adoption, and the evolving digital asset ecosystem.
View all stories by Jack Spancer →