 BTC
 ETH
 USDT
 BNB
 XRP
 USDC
 SOL
 TRX
 FIGR_HELOC
 ZEC
 HYPE
 DOGE
 XMR
 USDS

Zcash (ZEC) Price Prediction: ZEC Eyes $2,000 as Traders Assess $1,100 Floor and $1,516 Breakout Level
Zcash (ZEC) is approaching a pivotal point after retreating from its recent peak near $1,700.


The Zcash price rebound from the $1,100 region has renewed attention on whether buyers can regain control and push prices toward fresh highs or whether the market needs another correction first.
Several technical scenarios are emerging, with support between $1,100 and $1,300 playing a central role. A recovery above resistance could bring $2,000 into view, but continued selling pressure or a breakdown below key support would weaken the bullish outlook.
Zcash Rebounds After Testing the $1,100 Price Floor
Zcash experienced a sharp rally from the $400 range to approximately $1,700 before entering a corrective phase. The subsequent decline erased part of those gains and brought the price back toward a support region that traders are watching closely.
ZEC dropped to approximately $1,112 on October 8 before recovering to around $1,210 by October 10. The rebound indicates that buying interest emerged near the recent low, although further price action is needed to determine whether demand can sustain a recovery.
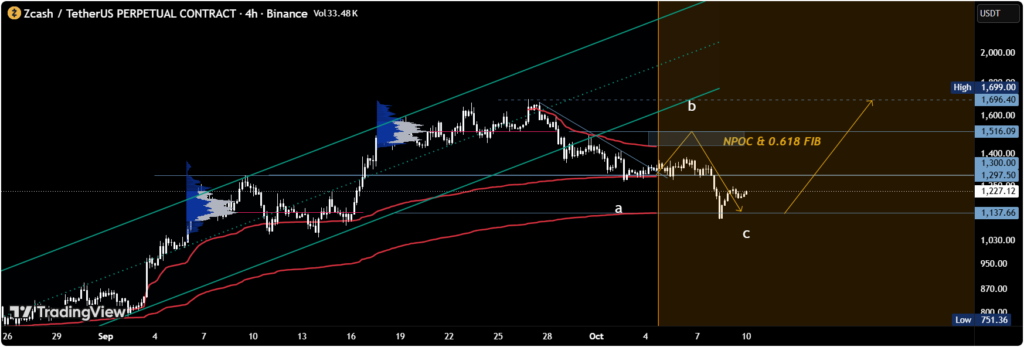
On the four-hour chart, TradingView analyst HyperProphit identifies $1,297–$1,335 as an immediate support area. Holding this zone could help stabilize the market and provide a base for another attempt at higher prices.
If selling resumes, $1,137 becomes an important level to monitor. Another analysis by @nordin_eth highlights $1,050–$1,100 as a potential turning zone following Zcash’s rapid advance.
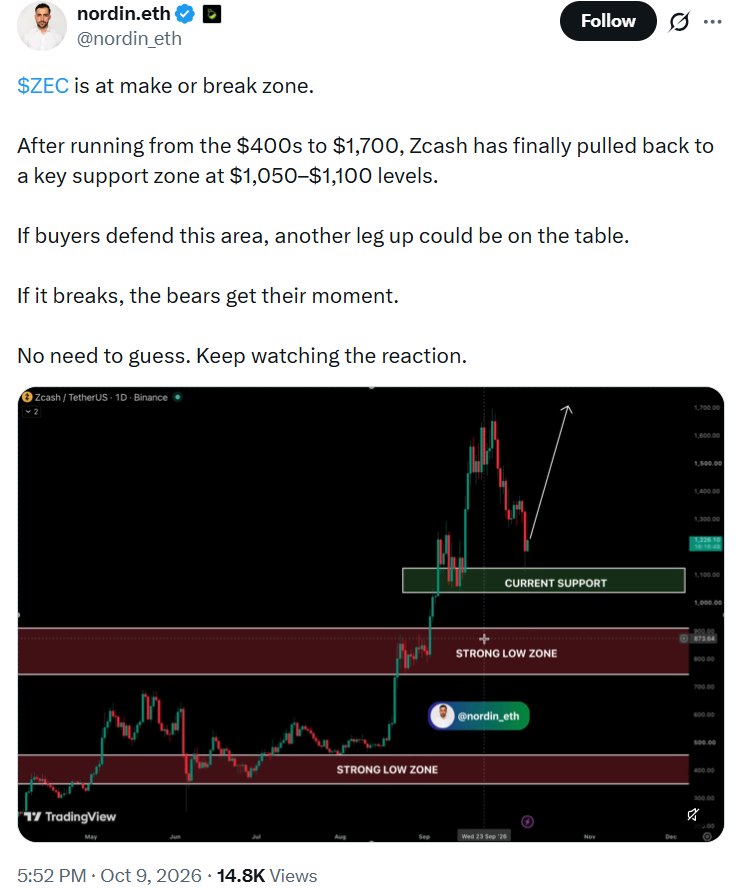
The proximity of these support levels makes the current price structure important for both bullish and bearish traders. A sustained rebound could improve the short-term outlook, while a decisive breakdown would raise questions about the strength of the previous rally.
$1,516 Emerges as a Key Barrier to Zcash Recovery
Although support is attracting attention, ZEC must also overcome several resistance levels before a move toward its previous high becomes more convincing.
HyperProphit identifies $1,516 as a significant technical barrier. The level coincides with a 0.618 Fibonacci retracement and a naked point of control, which represents a price associated with previously traded volume.
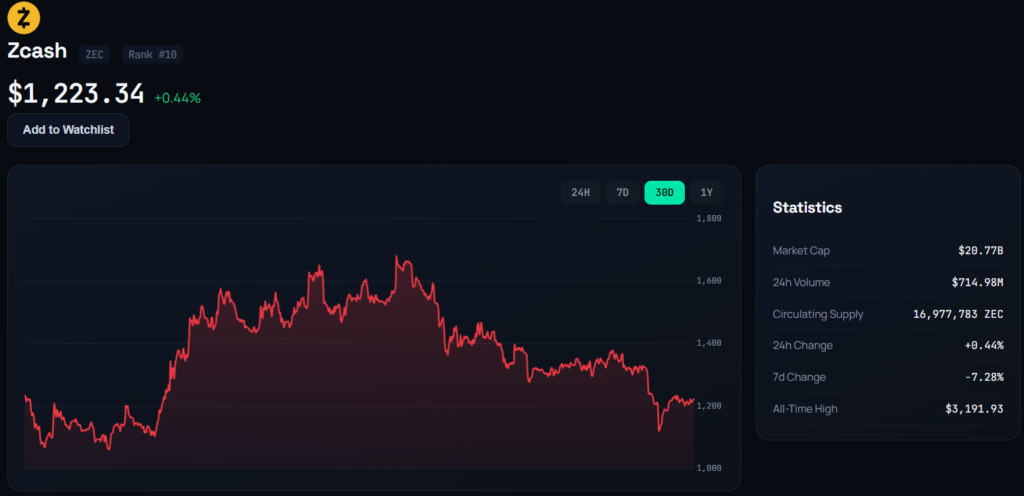
A sustained move above this threshold would provide stronger evidence that buyers are regaining control. It could also shift attention toward $1,699, the previous high identified in the analyst’s chart.
Before reaching $1,516, ZEC may encounter resistance between $1,405 and $1,457. TradingView analyst Wall_Street_Levels identifies this range as a monthly resistance zone where selling pressure could re-emerge.
Failure to overcome that area would leave the recovery vulnerable to another rejection. Conversely, a sustained move through the range, followed by a successful break above $1,516, would create a stronger technical case for a retest of the previous peak.
These levels provide a sequence of checkpoints rather than guaranteed turning points. Price behavior around each zone, particularly whether breakouts hold, will help determine whether momentum is improving.
Elliott Wave Forecast Suggests Another Decline Remains Possible
Not all technical scenarios point to an immediate recovery. HyperProphit’s Elliott Wave interpretation suggests that ZEC could still be completing an ABC correction following its advance toward $1,700.
Under this framework, the initial decline represents wave A, while a potential rebound toward $1,516 could form wave B. A subsequent wave C might then push the price toward $1,137 before the broader recovery attempt begins.
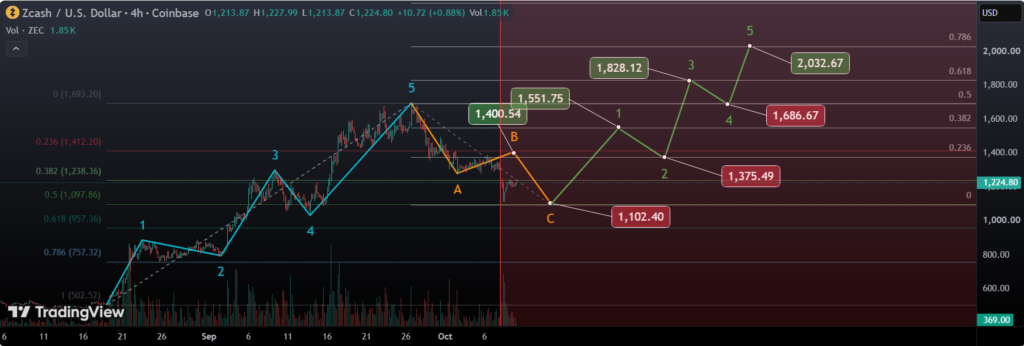
The pattern remains a technical interpretation rather than a confirmed market structure. If ZEC moves above resistance sooner than expected, the projected final downward leg may need to be revised.
TradingView analyst Candle_Mystic outlines a similar possibility in a one-month outlook. The analyst expects Zcash could attempt to reclaim $1,400 before potentially returning toward $1,100 around mid-October.
Following that possible correction, the forecast identifies a new high around Halloween and a potential move toward $2,000 in early November. However, both the price target and timing depend on support holding and bullish momentum returning.
The $1,100–$1,137 region is therefore central to these projections. A successful defense could support the view that the correction is nearing completion, while a sustained break below it would undermine that interpretation.
Bitcoin Weakness and Large-Holder Activity Create Market Risks
ZEC’s decline has occurred alongside pressure across the wider cryptocurrency market. Wall_Street_Levels links the altcoin pullback to expectations of a Bitcoin correction, highlighting how broader market weakness can affect assets that have recently experienced sharp gains.
The same analysis points to potential reductions in large-holder positions and spot-market outflows. If confirmed and sustained, these developments could indicate that some market participants are taking profits or reducing exposure after ZEC’s rapid appreciation.
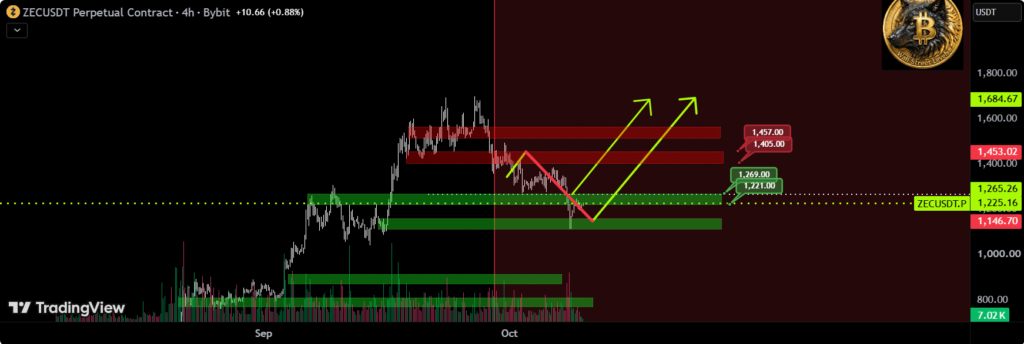
However, the available analysis does not establish the total volume of assets leaving the market or confirm that large holders are collectively abandoning their positions. The observations should be treated as possible indicators of selling pressure rather than conclusive evidence of a sustained distribution trend.
Miner sentiment is another factor identified by Wall_Street_Levels. Changes in miners’ willingness to retain or sell their ZEC holdings could influence market supply, although the available information does not quantify current miner activity.
Bitcoin’s direction, spot-market demand, and the strength of buying around support will therefore remain important variables. Even if Zcash maintains its technical structure, a broader deterioration in cryptocurrency sentiment could make a sustained recovery more difficult.
Could Zcash Break Above $1,700 and Reach $2,000?
A move toward $2,000 remains a possible bullish scenario, but ZEC must overcome several technical obstacles before that target becomes more plausible.
From approximately $1,210 on October 10, reaching $2,000 would require a gain of roughly 65%. The price would first need to stabilize above its immediate support region and recover through resistance at $1,405–$1,457.
A sustained breakout above $1,516 would provide additional confirmation of improving momentum. From there, the previous high near $1,699 would become the next major test. A convincing break above that peak would strengthen the argument for an extension toward $2,000.
The downside scenario remains relevant. If ZEC loses the $1,100–$1,137 region, the bullish recovery thesis would weaken, potentially exposing the lower $1,050 area highlighted in the technical analysis.
Zcash’s network developments provide additional context for the asset’s longer-term outlook, although technological improvements do not guarantee price appreciation. Traders will need to distinguish between developments in the underlying network and evidence of actual demand in the market.
Zcash Outlook Hinges on Support Defense and Breakout Confirmation
ZEC’s next major move may depend on whether buyers can turn the recent rebound into a sustained recovery. The $1,100–$1,300 region remains an important area to monitor, while $1,516 represents a key resistance level that could help confirm improving momentum.
If support holds and resistance levels are reclaimed, ZEC could revisit $1,699 and potentially advance toward $2,000. If selling pressure intensifies and the lower support region fails, another decline could invalidate the near-term bullish scenario.
For now, the available technical analyses do not establish that Zcash has reached a durable bottom. Price structure, trading volume, Bitcoin’s direction, and sustained buying interest will be important in determining whether the recent pullback becomes a launchpad for another rally or develops into a deeper correction.
The $2,000 target remains conditional on a series of technical confirmations. Until those conditions emerge, Zcash’s outlook remains dependent on how the market responds to the current support and resistance levels.

Julia Thornton is a cryptocurrency reporter covering blockchain, digital assets, and financial technology. She reports on market developments, regulation, exchange activity, and industry trends, delivering timely and accurate coverage of the global crypto ecosystem.
View all stories by Julia Thornton →