 BTC
BTC  ETH
ETH  USDT
USDT  BNB
BNB  USDC
USDC  XRP
XRP  SOL
SOL  TRX
TRX  FIGR_HELOC
  HYPE
HYPE  DOGE
DOGE  USDS
USDS  RAIN
RAIN  LEO
LEO 
XRP Price Prediction: Bears Tighten Grip as Descending Channel Keeps $0.91 Target in Focus
XRP remains under sustained short-term selling pressure, with multiple technical indicators pointing toward a cautious market outlook.


The cryptocurrency is trading within a well-established descending channel, while a separate bearish wave structure suggests that the next major support zone could emerge between $0.91 and $0.95 if current support levels fail to hold.
Although several momentum indicators are approaching oversold territory, analysts note that the broader technical picture has yet to show convincing evidence of a trend reversal. Instead, traders are closely monitoring whether XRP can defend key support or reclaim nearby resistance levels to invalidate the prevailing bearish structure.
XRP Price Trades Within a Well-Defined Descending Channel
Recent chart analysis shows that XRP has respected the boundaries of a descending channel for several weeks. Each recovery attempt has stalled beneath the channel’s upper trendline, while successive lower highs and lower lows continue to reinforce the existing downtrend.
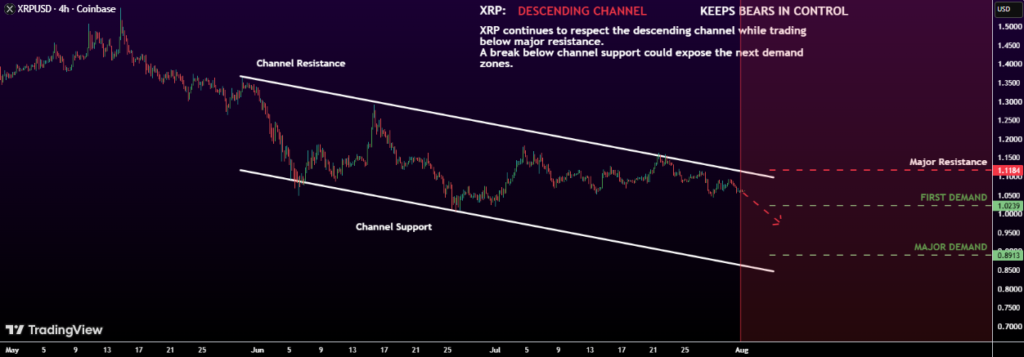
According to market analyst Structure_View, “every recovery attempt” has failed below the upper boundary, highlighting persistent selling pressure despite intermittent buying activity.
The upper channel line continues to act as dynamic resistance, limiting bullish momentum. If XRP breaks below the channel’s lower boundary, analysts identify the next significant demand area near $63.5 billion in market capitalization, followed by a stronger demand zone around $56.2 billion.
Conversely, a decisive breakout above the descending channel would invalidate the current bearish setup and indicate that buyers are beginning to regain short-term control.
Bearish Wave Structure Keeps $0.91–$0.95 in Focus
A separate four-hour technical analysis identifies an active bearish ABC corrective sequence that continues to favor lower prices unless market structure changes.
Following a rejection at overhead resistance, XRP has been consolidating around the key $1.06 pivot level, where buyers and sellers are competing for near-term directional control.
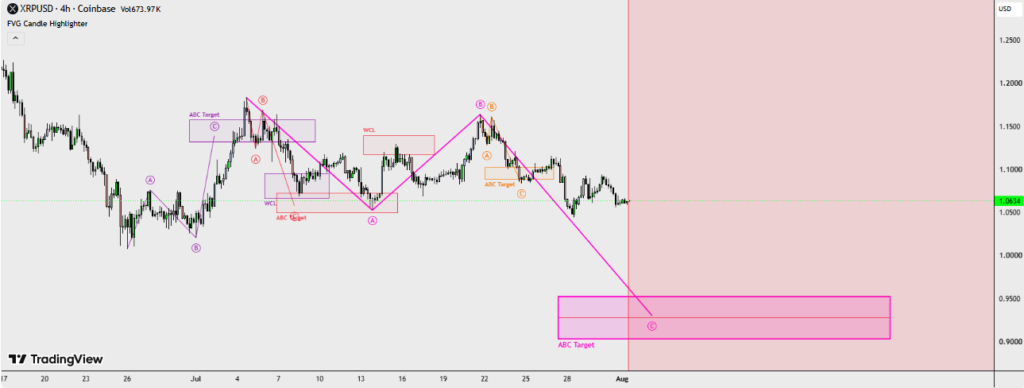
According to analyst SmellyTaz, the bearish sequence remains valid as long as XRP stays below the Wave (B) high near $1.16.
Under this scenario, the projected Wave (C) target remains between $0.91 and $0.95, while a sustained move above recent lower highs would invalidate the bearish sequence and reset the short-term structure.
The analysis emphasizes that price behavior around the current pivot zone will likely determine whether downside momentum continues or buyers regain control.
XRP Technical Indicators Continue to Favor Sellers
TradingView’s latest technical summary presents a neutral overall rating, but the underlying indicator breakdown leans noticeably bearish.
Across all indicators, TradingView currently reports:
- 14 Sell signals
- 9 Neutral signals
- 3 Buy signals
The daily timeframe maintains a sell bias, while the one-week outlook also favors sellers. The one-month assessment remains neutral, indicating that longer-term direction has yet to be confirmed.
Momentum indicators, however, paint a more balanced picture.
The Relative Strength Index (RSI-14) stands at 41.92, remaining within neutral territory rather than signaling oversold conditions. Meanwhile, the Stochastic %K reads 20.23, approaching oversold levels but without generating a confirmed reversal signal.
Other notable readings include:
- MACD (12,26): -0.01217 (Sell)
- Average Directional Index (ADX): 11.31 (Weak trend)
- Commodity Channel Index (CCI): -123.87
- Williams %R: -84.28 (Buy)
- Stochastic RSI Fast: 10.20
- Ultimate Oscillator: 42.68 (Neutral)
Taken together, these indicators suggest that selling momentum remains present, although several oscillators are beginning to approach levels that historically precede short-term relief rallies.
Moving Averages Reinforce the Downtrend
Moving averages continue to provide one of the strongest bearish signals for XRP.
TradingView reports 13 sell signals, 1 neutral, and only 1 buy across major moving averages.
XRP is currently trading below nearly every widely watched exponential and simple moving average, including the following:
- EMA (10): 1.07948
- SMA (10): 1.08165
- EMA (20): 1.08923
- SMA (20): 1.09327
- EMA (50): 1.12376
- EMA (100): 1.20736
- EMA (200): 1.40351
The Volume Weighted Moving Average (VWMA 20) at 1.09278 also remains above the current price, reinforcing resistance.
The only bullish exception comes from the Hull Moving Average (9) at 1.06222, which signals modest short-term support due to its greater sensitivity to recent price action.
Overall, the moving average structure indicates that buyers will likely need to reclaim multiple resistance levels before any sustained recovery can develop.
Key Support and Resistance Levels to Watch
Pivot point analysis highlights several important price levels that traders are monitoring.
Under the classic pivot system:
- Pivot: $1.08807
- Resistance 1: $1.15534
- Support 1: $0.99307
- Support 2: $0.92580
Because XRP is currently trading below its primary pivot level, resistance remains concentrated between $1.08 and $1.10.
On the downside, support near $1.00, followed by the $0.99–$0.93 range, could become increasingly important if sellers maintain control. Notably, this area aligns closely with the bearish Wave (C) projection toward $0.91–$0.95, strengthening its technical significance.
Market Outlook
The current XRP price prediction remains driven primarily by technical structure rather than fundamental developments. The descending channel, bearish ABC sequence, and overwhelmingly negative moving-average signals continue to favor sellers in the near term.
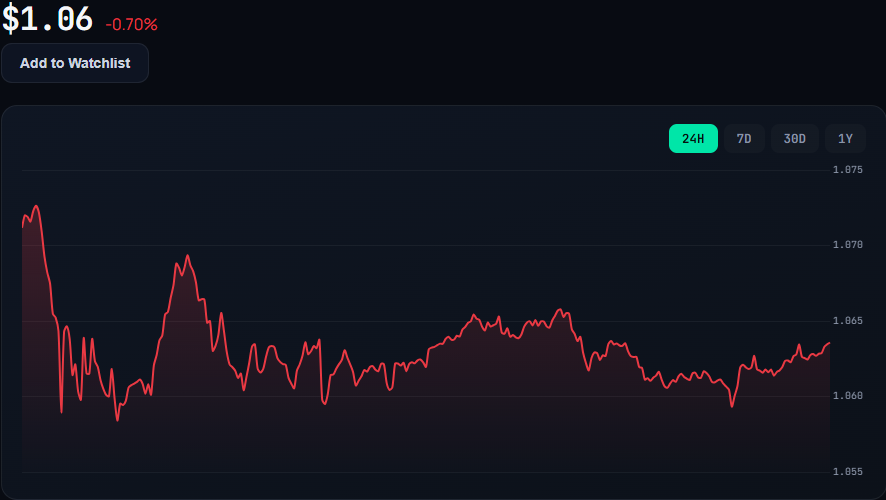
At the same time, several oscillators are nearing oversold territory, suggesting that downside momentum could begin to weaken if buying interest returns. For now, however, analysts generally view a confirmed break above channel resistance and the $1.16 structural level as necessary to invalidate the prevailing bearish outlook.
Until those conditions are met, traders are expected to keep a close watch on the lower support zones, with the $0.91–$0.95 area remaining one of the primary technical targets if current selling pressure persists.

Riva A. Nahar joins our team as a Crypto Journalist, covering cryptocurrency markets, blockchain developments, DeFi, and emerging trends across the digital-asset industry. With a focus on clear, accurate, and well-researched reporting, Riva brings a balanced perspective to fast-moving crypto news and market developments. Her work aims to make complex industry developments accessible while maintaining strong journalistic standards.
View all stories by Riva A. Nahar →