 BTC
BTC  ETH
ETH  USDT
USDT  BNB
BNB  XRP
XRP  USDC
USDC  SOL
SOL  TRX
TRX  ZEC
ZEC  FIGR_HELOC
  HYPE
HYPE  DOGE
DOGE  LINK
LINK  XMR
XMR 
XRP Price Prediction: Can Bulls Defend $1.10 Support Before a Potential 2027 Cycle Peak?
The XRP price is trading near a pivotal technical zone as analysts weigh whether the cryptocurrency can maintain support above $1.10 and preserve its broader bullish structure.

While short-term indicators suggest consolidation, several market observers argue that the long-term XRP cycle remains intact, with historical chart patterns pointing toward a possible market peak later in the current cycle.
The latest technical outlook combines long-term cycle analysis with shorter-term price action, highlighting the importance of support levels around $1.10 as traders assess the next move for Ripple XRP.
Long-Term Cycle Model Keeps Focus on 2027
Crypto analyst ChartNerdTA revisited XRP’s multi-year price structure using Gaussian regression bands, a statistical tool designed to identify long-term market cycles.
According to the analyst, previous XRP market cycles have followed a similar pattern. After reaching the upper regression band during major bull markets, the asset eventually corrected toward the middle band, where long-term cycle lows historically formed before the next advance.
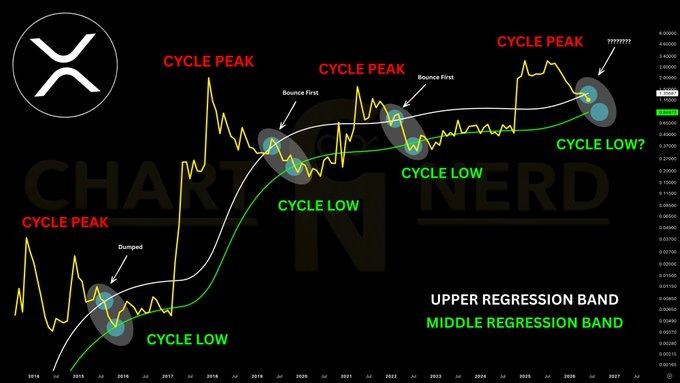
The updated chart comes after XRP declined from approximately $1.35 to $1.00, a move that altered the earlier outlook. Unlike previous cycles, however, the analyst noted that XRP has yet to produce the type of relief rally that followed similar corrections in 2015 and other historical periods.
Looking further ahead, the revised projection extends into 2027, marking a potential cycle peak while raising the question of whether the middle regression band could once again serve as the next major market bottom after the current cycle concludes.
Although historical cycle models cannot predict future price movements with certainty, they offer context by comparing current market behavior with previous XRP market structures.
XRP Price Holds Above Critical Support
Shorter-term technical analysis paints a more balanced picture.
Market analyst Khiwe described the broader structure as bullish, although he cautioned that recent price action remains constrained by the reaction between the $1.0800 swing low and the $1.1825 resistance zone.
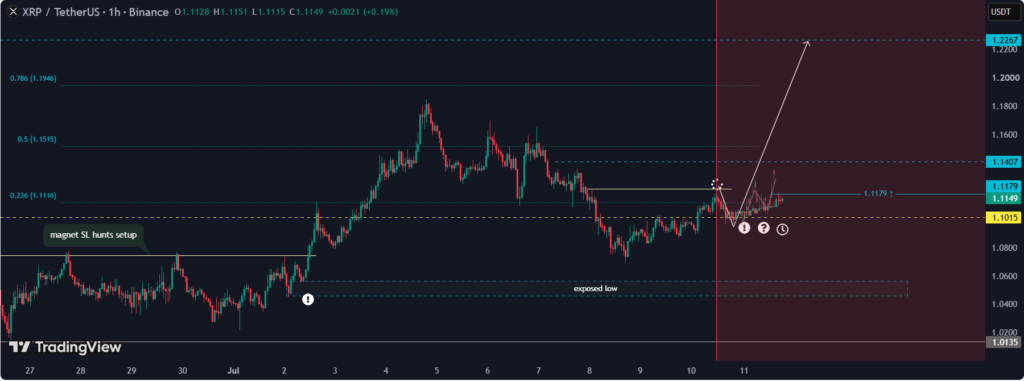
According to the analyst, the $1.1015 level has become a key area to monitor.
“A higher low holding above 1.1015 could potentially shift the short-term tone back toward bullish continuation,” Khiwe said.
The analyst added that XRP is approaching an important resistance area where sellers may re-enter the market. Conversely, losing the $1.1015 support could expose lower liquidity levels and increase the likelihood of sharp, volatile price swings.
The analysis suggests that maintaining support above $1.10 would strengthen the case for a recovery, while a decisive breakdown could shift momentum back toward recent lows.
XRP Price Today: Technical Indicators Remain Neutral
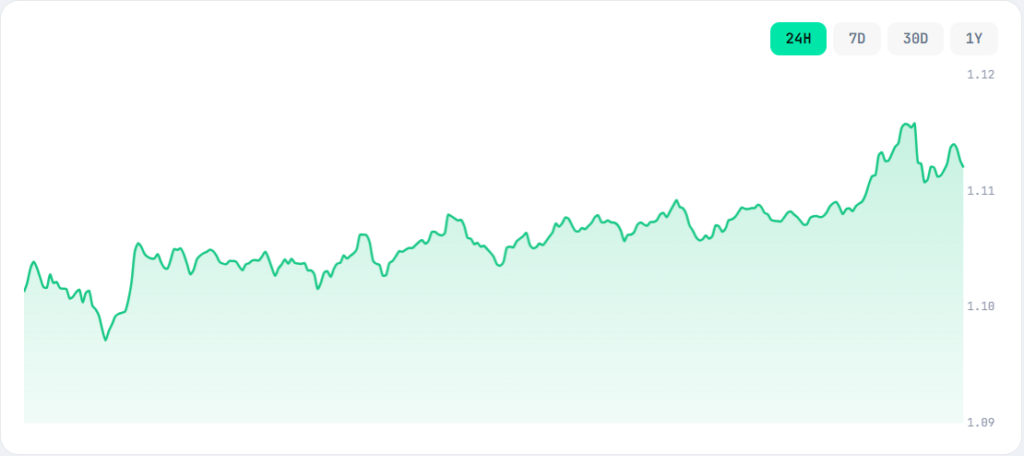
As of mid-July, the current XRP price on Bitstamp was approximately $1.1104, posting an intraday gain of around 0.60%.
TradingView’s overall technical summary rates XRP as Neutral, reflecting mixed signals across momentum indicators and moving averages rather than a clear directional trend.
Among oscillators:
- RSI (14): 47.56, indicating balanced momentum without overbought or oversold conditions.
- Stochastic %K: 51.49 and Stochastic RSI: 61.35, both remaining in neutral territory.
- CCI (20): 33.19 and ADX (14): 16.21, suggesting weak trend strength.
- MACD (12,26): -0.01386, one of the few indicators generating a Buy signal, hinting at improving short-term momentum.
- Momentum (10): 0.05840 and Bull Bear Power: -0.00123 continue to register Sell signals.
Overall, oscillators produce 2 Sell, 8 Neutral, and 1 Buy signal, reinforcing the view that XRP is consolidating rather than establishing a decisive trend.
Moving Averages Continue to Favor Caution
Moving averages present a slightly more cautious outlook.
Short-term readings remain mixed. The 10-period EMA at $1.1065 generates a Buy signal, while the 10-period SMA at $1.1186 remains on Sell. Similarly, the 20-period SMA at $1.0912 supports the current price, whereas the 20-period EMA at $1.1113 still signals weakness.
Longer-term averages continue to lean bearish.
The 30 EMA ($1.1274), 50 EMA ($1.1679), and 200 EMA ($1.4764) all remain above the current market price, indicating that XRP has yet to reclaim key long-term trend levels. However, the VWMA (20) at $1.0937 and Hull Moving Average (9) at $1.0882 continue to provide nearby dynamic support, while the Ichimoku Base Line at $1.1313 remains neutral.
Collectively, TradingView’s moving averages produce 10 Sell, 1 Neutral, and 4 Buy signals.
Key XRP Price Levels to Watch
Technical pivot levels identify several important areas that could shape XRP’s next move.
The Classic Pivot Point sits near $1.1284, placing the market just below its central trading level.
Immediate resistance is located around $1.2489, while analysts continue watching the broader $1.15-$1.25 region for signs of stronger selling pressure.
On the downside, the first major support lies near $0.9180, followed by $0.7975 if bearish momentum accelerates. In the near term, however, traders continue to monitor the $1.10-$1.09 area, which has emerged as the most important support zone during the current consolidation.
Outlook
The latest XRP price prediction reflects a market caught between long-term optimism and short-term caution.
Historical cycle analysis suggests XRP remains within a broader bullish framework that could extend toward a later-cycle peak, while shorter-term technical indicators show a market still searching for direction. Holding above the $1.10-$1.1015 support region would help preserve the current structure, but reclaiming resistance near $1.15-$1.25 may be necessary before momentum shifts more decisively in favor of buyers.
For now, technical indicators point to consolidation rather than confirmation of either a breakout or a deeper correction, leaving upcoming reactions around these key price levels in focus.

Jack Spencer is a financial journalist and crypto market analyst covering digital assets, blockchain innovation, and global market developments. His reporting focuses on cryptocurrency price trends, regulation, institutional adoption, and the evolving digital asset ecosystem.
View all stories by Jack Spancer →
Responses
0