 BTC
BTC  ETH
ETH  USDT
USDT  BNB
BNB  XRP
XRP  USDC
USDC  SOL
SOL  TRX
TRX  ZEC
ZEC  FIGR_HELOC
  HYPE
HYPE  DOGE
DOGE  XMR
XMR  LINK
LINK 
Ethereum (ETH) Price Prediction: Bearish EMA Breakdown Signals Caution as ETH Struggles Below $1,900
Ethereum is facing renewed selling pressure after failing to establish a sustained move above the $1,900 area, leaving traders focused on whether the cryptocurrency can defend its short-term technical support.


The latest Ethereum price action presents a mixed picture. Some analysts have identified a bearish market-structure shift following a break below a rising trendline, while TradingView’s technical indicators show that shorter-term momentum remains relatively constructive.
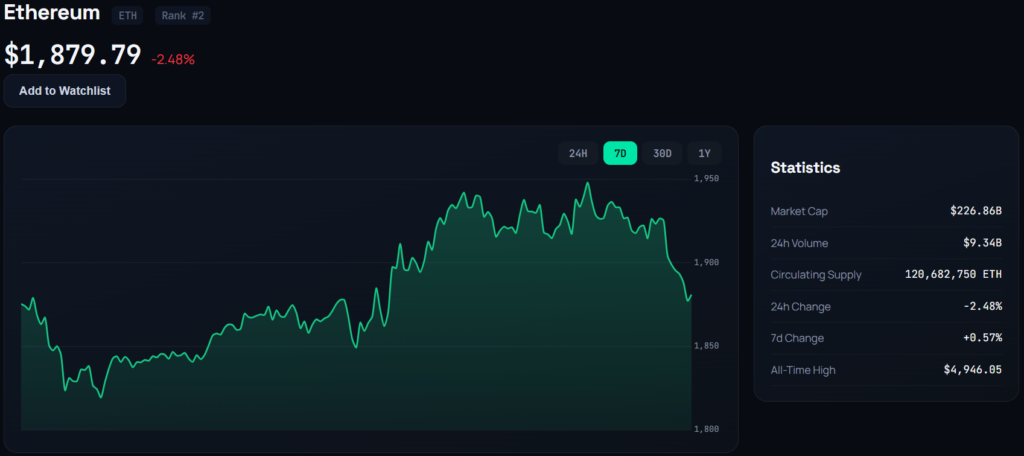
ETH was trading around $1,893.90 in the technical data reviewed, down approximately 2.04% on the session. The price was also positioned close to the $1,890-$1,900 region, an area that has become an important battleground between buyers and sellers.
The key question for the current Ethereum price prediction is whether ETH can reclaim $1,900 and overcome resistance from longer-term moving averages. Failure to do so could keep the asset vulnerable to further downside, while a sustained recovery above resistance would weaken the immediate bearish case.
Ethereum Price Prediction Faces Resistance Below $1,900
Crypto market commentator @CryptoApexPro recently described Ethereum’s setup as bearish after a gap fill was followed by rejection. The analysis also highlighted a roughly $50 decline below the $1,900 area and identified the 100 EMA as significant resistance.
The accompanying daily chart reportedly showed ETH sweeping recent highs before reversing lower, with liquidity and a potential gap area concentrated around $1,890-$1,900.

This places the $1,900 threshold at the center of the current Ethereum price analysis. A sustained move above that region could indicate that buyers are absorbing the recent selling pressure. Conversely, repeated rejection would reinforce the view that sellers remain active near the upper end of the recent range.
The analysis is based on technical market structure and should not be treated as confirmation of a future price direction. Price gaps, liquidity zones and moving averages can provide useful reference points, but they do not guarantee that a particular level will hold or break.
ETH Price Prediction: Bearish Market Structure Emerges
Another technical analysis describes Ethereum as having broken below a previously rising trendline, accompanied by what the analyst calls a “Market Structure Shift to the downside.”
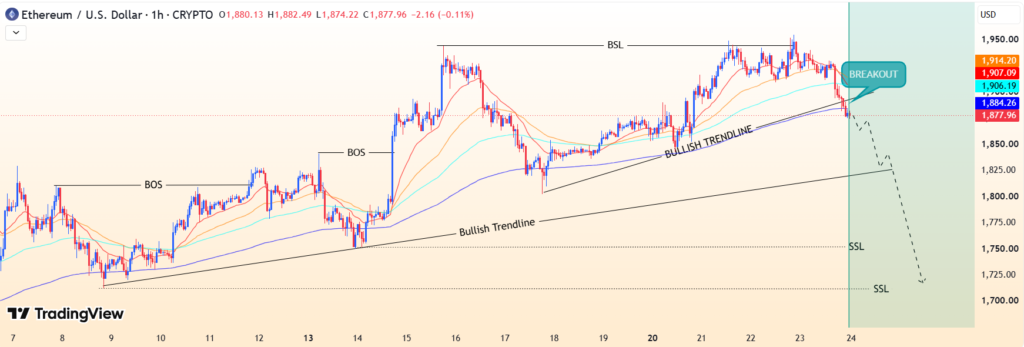
The analysis points to several factors behind the bearish interpretation, including the formation of lower highs and lower lows and a breakdown across the 20-, 50-, 100- and 200-period EMA structure.
Under this framework, the bearish scenario remains valid if ETH continues to trade below the broken trendline and sellers maintain control of short-term price action.
The setup would become less convincing if Ethereum quickly reclaimed the trendline and began forming higher highs and higher lows again. Such a move would suggest that the breakdown may have been temporary rather than the start of a sustained downtrend.
For the current ETH price prediction, confirmation remains critical. A single trendline break is not sufficient to establish a long-term reversal, particularly when other technical indicators continue to show mixed readings.
Ethereum Technical Analysis Shows Conflicting Signals
TradingView’s technical data provides a more balanced assessment than the bearish chart interpretations.
Ethereum was trading near $1,893.90 in the referenced data, while the overall technical summary remained Neutral. The oscillator section recorded one sell signal, nine neutral readings and one buy signal.
The 14-period Relative Strength Index (RSI) stood at 59.0, placing it in neutral territory. The reading indicates that ETH was not in an extreme overbought or oversold condition and still had room to move in either direction.
The Stochastic %K was elevated at 84.5, while the Commodity Channel Index (CCI) stood at 91.8. Both remained classified as neutral despite their relatively high readings.
The MACD Level (12, 26) produced a buy signal at 47.2, pointing to some positive short-term momentum. However, the Momentum (10) indicator showed a sell signal at 120.1, suggesting that recent upward pressure may have started to lose strength.
The Average Directional Index (ADX) was 23.7, indicating moderate but not especially strong trend strength.
Taken together, these readings do not provide a clear directional signal. The oscillator data instead suggests that Ethereum remains at a technical crossroads, with traders likely looking for a decisive break above resistance or a loss of nearby support.
Short-Term Averages Remain Supportive
Ethereum’s moving-average structure provides a more constructive signal over shorter periods.
The 10-period EMA was around $1,879.90, while the 10-period SMA stood near $1,890.40. Both were classified as buy signals in the referenced TradingView data, with ETH trading around or above these short-term averages.
The 20-period EMA was approximately $1,837.60 and the 20-period SMA around $1,834.20. The 30- and 50-period averages were also described as carrying buy signals.
This configuration suggests that Ethereum’s recent recovery has established a degree of short-term technical support.
However, the picture changes across longer timeframes.
The 100-period EMA was near $1,935.90 and the 100-period SMA around $1,976.00, with both generating sell signals. The 200-period EMA stood near $2,191.70, while the 200-period SMA was approximately $2,160.10. Both longer-term averages also carried sell signals.
This creates a clear divide in the Ethereum price analysis. ETH remains above several shorter-term averages but below longer-term trend measures. Such a structure can occur during a recovery attempt within a broader correction or during an extended period of consolidation.
ETH Price Faces Key Resistance at $1,900-$1,950
The $1,900-$1,950 region has become a critical technical zone for Ethereum.
The classic pivot analysis places R1 at approximately $1,890.50, close to the current market price in the reviewed data. The next major resistance level, R2, is around $2,211.20.
The 100-period EMA at approximately $1,935.90 adds another layer of resistance above the $1,900 threshold.
This creates a cluster of technical barriers between roughly $1,890 and $1,950. A sustained move through this zone could improve the short-term outlook and challenge the bearish market-structure thesis.
On the other hand, continued rejection in this area could keep ETH under pressure and reinforce the view that the recent recovery has not yet developed into a broader trend reversal.
The $1,900 level is therefore important not simply because it is a round-number threshold, but because it sits near several technical reference points.
What Happens if ETH Loses Support?
While the immediate focus remains on resistance, the downside levels are equally important for the current Ethereum forecast.
The classic pivot point is around $1,697.80, while S1 is approximately $1,377.10. These levels are significantly below the current price and should not be interpreted as immediate targets without a confirmed breakdown.
A more immediate concern would be the loss of short-term moving-average support in the $1,800-$1,850 region. The 20-period EMA and SMA are positioned around $1,838 and $1,834, respectively.
A sustained move below these levels could weaken the recent recovery structure and increase the probability of a deeper retracement.
However, the current technical data does not confirm such a breakdown. ETH remains above several shorter-term moving averages, while the RSI at 59.0 is not showing an extreme bearish condition.
The key issue is therefore whether sellers can turn the current resistance near $1,900-$1,950 into a sustained rejection or whether buyers can regain control.
Ethereum ETF Flows Provide a Mixed Market Backdrop
Ethereum’s price action is also unfolding against a changing institutional backdrop.
U.S. spot Ethereum ETFs recorded several positive daily inflows in July. Farside Investors’ data showed net inflows of $38.0 million on July 20, $37.5 million on July 21 and $72.7 million on July 22. The figures indicate that demand for spot ETH investment products remained active during the period, although individual funds experienced different flow patterns.
Earlier in July, Ethereum also benefited from a period of stronger ETF demand. CoinDesk reported that U.S. spot ether ETFs attracted $96 million during the first three trading days of the week ending July 16, with much of the inflow concentrated in BlackRock’s product.
ETF flows do not guarantee a bullish ETH price prediction, but they provide useful context for understanding market demand. Continued inflows can potentially support the underlying asset, while persistent outflows may add pressure during periods of weak sentiment.
The flow data therefore offers a counterpoint to the purely technical bearish interpretation. While ETH is struggling with resistance on the chart, investment demand through regulated products has shown signs of resilience.
Bulls Need to Reclaim $1,900
The immediate ETH price prediction depends heavily on how Ethereum behaves around the $1,900 level.
A sustained move above $1,900 would first challenge the bearish interpretation and could bring the $1,935-$1,950 region into focus. Clearing that area would be more significant because it would place ETH above the 100-period EMA, which currently acts as a longer-term resistance reference.
Beyond that, the classic R2 pivot near $2,211 would represent a substantially higher technical hurdle.
On the downside, a loss of the $1,800-$1,850 area could signal that the short-term recovery is losing momentum. The $1,700 region, close to the classic pivot at $1,697.80, would then become a more relevant reference point if selling pressure accelerates.
For now, neither scenario has been confirmed.
Ethereum Price Outlook
Ethereum’s immediate price outlook is centered on the $1,900-$1,950 resistance zone.
A sustained breakout above this area could weaken the bearish EMA breakdown thesis and signal that buyers are attempting to regain control. The next major resistance reference would then be around $2,211 based on the classic pivot structure.
Conversely, repeated rejection near $1,900 followed by a loss of the $1,800-$1,850 support region would strengthen the bearish interpretation and potentially expose ETH to deeper corrective pressure.
The current Ethereum technical analysis therefore points to a market awaiting confirmation rather than a clearly established trend.
For now, ETH remains above several short-term moving averages but below its longer-term 100- and 200-period averages. With RSI at 59.0 and ADX at 23.7, the indicators do not show an extreme market condition or a particularly strong trend.
As a result, the next decisive move around the $1,900 resistance and nearby support levels may provide a clearer signal about whether Ethereum is beginning another leg lower or attempting to reclaim its broader recovery structure.

Jack Spencer is a financial journalist and crypto market analyst covering digital assets, blockchain innovation, and global market developments. His reporting focuses on cryptocurrency price trends, regulation, institutional adoption, and the evolving digital asset ecosystem.
View all stories by Jack Spancer →
Responses
0