 BTC
BTC  ETH
ETH  USDT
USDT  BNB
BNB  XRP
XRP  USDC
USDC  SOL
SOL  TRX
TRX  ZEC
ZEC  FIGR_HELOC
  HYPE
HYPE  DOGE
DOGE  XMR
XMR  LINK
LINK 
Ethereum (ETH) Price Today: Mixed Indicators Signal Caution as ETH Trades Around $1,790
Ethereum (ETH) is trading near $1,790 after a modest pullback in the latest session, with technical indicators presenting a balanced picture as traders assess the cryptocurrency's next directional move.


While several short-term trend indicators remain supportive, momentum oscillators suggest caution as Ethereum price approaches an important resistance zone around $1,800-$1,850.
The latest Ethereum price analysis from TradingView shows the market in a consolidation phase rather than a decisive uptrend or downtrend, reflecting mixed signals across multiple technical indicators.
Ethereum Price Today Holds Near Key Technical Zone
The Ethereum price today stands at approximately $1,790.30, down about 0.30% during the latest session. Despite the slight decline, ETH continues to trade above several important short-term moving averages, indicating that buyers have so far defended recent gains.
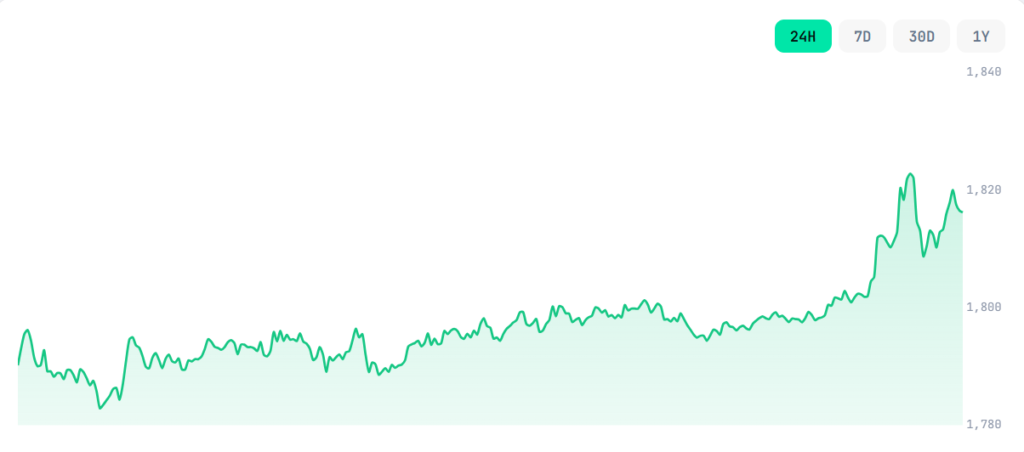
TradingView’s overall technical summary assigns Ethereum a “Neutral” rating, based on a combination of 10 Buy, 8 Neutral, and 8 Sell signals. The mixed reading suggests that neither bulls nor bears currently hold a decisive advantage.
Market participants are closely monitoring whether the ETH price can establish a sustained move above the psychological $1,800 level, which could shift short-term sentiment. Conversely, losing support around $1,750-$1,700 may invite renewed selling pressure.
Ethereum Technical Analysis Shows Conflicting Momentum Signals
The latest Ethereum technical analysis reveals that momentum indicators are largely neutral, although several oscillators indicate the market may be approaching stretched conditions.
The Relative Strength Index (RSI-14) is currently 56.9, comfortably within neutral territory, indicating that buying and selling pressure remains relatively balanced. Meanwhile, the Stochastic %K (14,3,3) reads 81.8, while the Fast Stochastic RSI stands at 88.2. Although both are approaching traditionally overbought levels, TradingView continues to classify them as neutral rather than outright bearish.
The Commodity Channel Index (CCI-20) sits at 88.1, also reflecting neutral market conditions.
One of the stronger bullish signals comes from the MACD (12,26), which posts a reading of 9.3, indicating that the MACD line remains above its signal line and continues to support short-term upward momentum.
However, several indicators continue to advise caution. Momentum (10) generates a Sell signal at 183.0, while Williams %R (14), reading -14.4, also issues a Sell signal as the market nears overbought territory. Bull Bear Power, currently at 104.0, similarly favors sellers.
Elsewhere, the Awesome Oscillator (75.1) and Ultimate Oscillator (58.9) remain neutral, while the Average Directional Index (ADX-14) stands at 23.6, suggesting the current trend lacks strong directional conviction.
Overall, oscillator readings indicate that Ethereum’s recent recovery remains intact but is not supported by overwhelming momentum.
Moving Averages Continue to Favor Short-Term Bulls
Unlike the oscillators, moving averages continue to paint a more constructive picture for the price of Ethereum.
TradingView reports 9 Buy, 5 Sell, and 1 Neutral signal across its moving average indicators.
Short-term averages continue to support the current trend:
- EMA (10): $1,751.1 – Buy
- SMA (10): $1,766.0 – Buy
- EMA (20): $1,729.8 – Buy
- SMA (20): $1,687.1 – Buy
- EMA (30): $1,741.5 – Buy
- SMA (30): $1,700.4 – Buy
- SMA (50): $1,767.5 – Buy
One notable exception is the EMA (50) at $1,799.0, which currently issues a Sell signal, placing immediate resistance close to the current ETH price today.
Longer-term trend indicators remain considerably weaker.
The EMA (100) sits at $1,952.3, while the SMA (100) stands at $2,014.9, both maintaining Sell signals. Likewise, the EMA (200) at $2,232.1 and SMA (200) at $2,227.4 continue to reflect the broader bearish structure that has remained in place since Ethereum retreated from higher levels earlier this year.
Additional indicators provide further context. The VWMA (20) at $1,679.3 and Hull Moving Average (9) at $1,770.7 both issue Buy signals, while the Ichimoku Base Line remains neutral at $1,674.0.
Key Resistance Levels Remain in Focus
Classic pivot points continue to highlight several important price levels that traders are watching closely.
The primary pivot sits at $1,697.8, while the first major resistance (R1) is located at $1,890.5. Additional resistance levels appear at $2,211.2 (R2) and $2,724.6 (R3).
On the downside, immediate support begins near $1,377.1 (S1), followed by $1,184.4 (S2) and $671.0 (S3).
More immediately, traders continue to focus on the $1,800-$1,850 region, where recent price action has repeatedly slowed. Holding above the $1,700-$1,750 support area could help preserve the current recovery attempt, while a move below the central pivot may increase downside pressure.
Analyst Eyes $1,850 as Immediate Test
Crypto market analyst Crypto Tony highlighted the same resistance region in a recent market update, suggesting Ethereum could extend toward $1,850 on the four-hour chart if buyers maintain momentum.
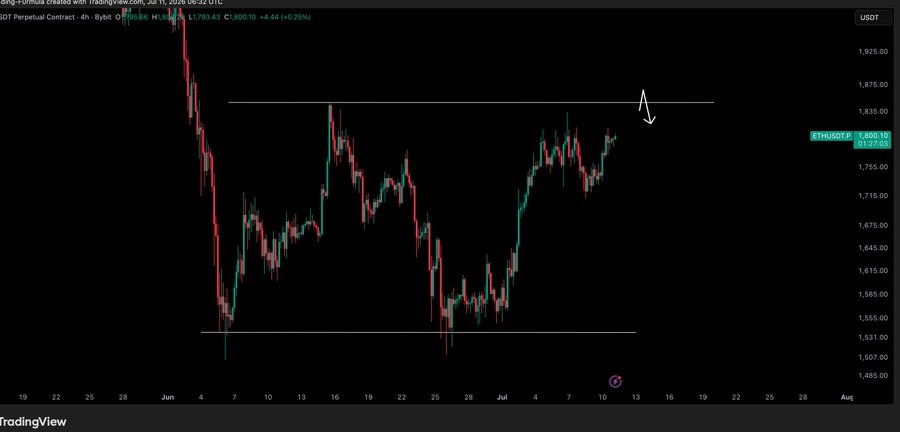
Responses from traders were mixed. Some agreed that the setup remains constructive after Ethereum’s recent consolidation, while others argued that $1,850 could become a significant rejection zone unless buying volume strengthens.
The broader technical picture supports that cautious stance. Although short-term moving averages favor buyers, higher-timeframe indicators—including the one-week and one-month TradingView summaries—continue to lean bearish, suggesting that confirmation from higher resistance levels would be needed before the broader trend meaningfully changes.
For now, Ethereum remains in a consolidation phase, with technical indicators pointing to a market that is balanced between improving short-term momentum and persistent long-term resistance.

Jack Spencer is a financial journalist and crypto market analyst covering digital assets, blockchain innovation, and global market developments. His reporting focuses on cryptocurrency price trends, regulation, institutional adoption, and the evolving digital asset ecosystem.
View all stories by Jack Spancer →
Responses
0