 BTC
BTC  ETH
ETH  USDT
USDT  BNB
BNB  XRP
XRP  USDC
USDC  SOL
SOL  TRX
TRX  ZEC
ZEC  FIGR_HELOC
  HYPE
HYPE  DOGE
DOGE  XMR
XMR  WBT
WBT 
Bitcoin (BTC) Price Today: FOMC Showdown Puts $74K Support and $78K Resistance to the Test
Bitcoin (BTC) is approaching a decisive technical zone near $76,000 as traders prepare for the Federal Reserve’s September policy announcement. Short-term indicators remain under pressure, but longer-term moving averages are still providing support.


The conflicting signals have left the Bitcoin price trapped between nearby support and resistance. A 4-hour TD Sequential buy signal has emerged during the decline, while weakening ETF flows and bearish short-term averages point to continued caution.
$76K Bitcoin Price Faces a Technical Crossroads
Bitcoin traded near $76,015 on September 16, with recent selling leaving the cryptocurrency below several short-term trend indicators. The latest TradingView data gives BTCUSD an overall neutral technical rating, combining 10 sell signals, nine neutral readings, and seven buy signals.

The mixed reading reflects a market that has lost some short-term momentum without fully damaging its longer-term structure.
Bitcoin remains above several important longer-period averages. The 50-day EMA stands near $73,532, while the 100-day EMA is around $71,345 and the 200-day EMA sits near $73,080.
That leaves the low-$70,000s as an important area for the current Bitcoin price analysis. A sustained hold above those averages would preserve the broader technical structure, while a break beneath them would represent a more significant deterioration.
Why $78K Matters for BTC
The immediate challenge for Bitcoin is overhead resistance rather than a lack of potential support.
The 10-day EMA is around $77,050 and the 10-day SMA is near $77,278. The 20-day EMA is approximately $76,820, while the 20-day SMA sits around $78,046.
Consequently, the $76,800-$78,000 area contains several closely grouped technical barriers. Bitcoin has struggled to regain this zone after its recent decline.
A sustained move above the cluster would put the market back above several short-term averages. Fibonacci pivot calculations then identify resistance around $81,430, making the low-$80,000s the next broader area to watch.
Failure to recover $78,000, meanwhile, would leave BTC below most of its shorter-term trend gauges.
A TD Sequential Signal Challenges the Bearish Setup
The recent weakness has not gone unnoticed by technical traders, but one indicator is pointing in the opposite direction.
Ali Martinez highlighted a TD Sequential buy signal on Bitcoin’s four-hour chart as BTC traded around $75,898. The setup appeared after a sequence of declining price action and was accompanied by previous examples in which Bitcoin subsequently rebounded.

According to the analysis, three earlier signals were followed by gains of 6.98%, 1.90%, and 4.36%.
The TD Sequential is generally used to identify potential trend exhaustion. However, a buy signal does not confirm that a reversal will occur. Its relevance depends on subsequent price action, particularly when a major macroeconomic event is approaching.
In the current setup, the indicator provides evidence of possible exhaustion rather than confirmation of a new uptrend.
FOMC Becomes the Market’s Next Catalyst
The Federal Reserve’s September meeting is taking place on September 15-16, with the policy statement scheduled for 2 p.m. ET on September 16 and Fed Chair Jerome Powell’s press conference following at 2:30 p.m. ET. Updated economic projections and the dot plot are also due.

The rate decision is particularly relevant because markets are already focused on the future path of monetary policy. Reuters reported ahead of the announcement that markets were pricing a roughly 92.7% probability of a 25-basis-point increase. The same report highlighted a rise in Treasury yields, with the 10-year yield moving above 5%.
For Bitcoin, the policy statement and projections could therefore be as important as the rate decision itself. A more restrictive message could keep yields elevated and weigh on risk appetite. A less restrictive signal could have the opposite effect.
The initial market reaction may also be amplified because BTC is already sitting close to several technical thresholds.
ETF Demand Has Lost Momentum
Institutional flows provide another piece of the Bitcoin price picture.
Glassnode’s recent analysis showed that U.S. spot Bitcoin ETF flows, which had turned positive for more than three weeks from late August, subsequently shifted toward net redemptions by mid-September.

The timing is notable. Strong ETF inflows coincided with Bitcoin’s recovery toward the $80,000-$95,000 region, while the reversal in flows occurred as the cryptocurrency retreated toward the mid-$70,000s.
Glassnode’s September 14 market report also described Bitcoin as trading around $76,800 after a 4.4% weekly decline, with spot and perpetual selling and ETF outflows contributing to the pressure. At the same time, the firm characterized the market as absorbing selling pressure rather than confirming a clear structural breakdown.
The flow data therefore adds caution to the technical reversal signal. The recent decline has not been accompanied by a sustained return of institutional buying through spot ETFs.
Momentum Is Weak but Not Deeply Oversold
Bitcoin’s oscillators offer a less decisive picture than its short-term moving averages.
The 14-period RSI is around 47, keeping it in neutral territory. Stochastic %K is near 17, while Williams %R is around -94. Both readings indicate that momentum has weakened considerably, although the aggregate oscillator rating remains neutral.
The MACD and Momentum indicators are more negative. Momentum stands near -4,965 and generates a sell signal, while MACD remains positive in level terms but is classified as a sell signal in the TradingView summary because of its current configuration.
This combination suggests that sellers have maintained recent control, but Bitcoin has not reached a uniform oversold condition across the indicator set.
That distinction is relevant because a weak market can stabilize without immediately producing a trend reversal.
$74K Is the Critical Downside Reference
The classic pivot calculation places Bitcoin’s central pivot near $74,081, giving the level additional significance within the current structure.
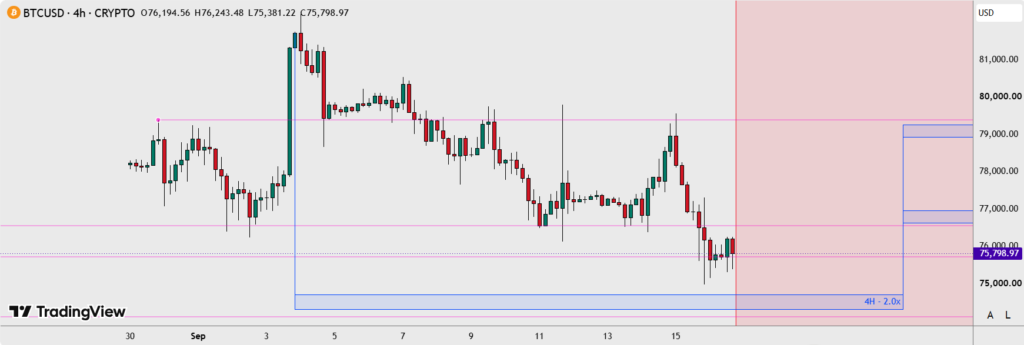
BTC is currently above that threshold. A sustained break beneath $74,000 would weaken the immediate consolidation and could shift attention toward the $66,700-$70,000 region.
Classic support is calculated near $66,706, while Fibonacci calculations place a comparable support level around $66,731. Several longer-term moving averages also sit above that region, particularly around the low-$70,000s.
The $74,000 level therefore separates the current consolidation from a deeper technical retracement scenario.
For bulls, maintaining that area would keep the broader structure intact. For bears, a confirmed breakdown would provide stronger evidence that the recent weakness is developing into a larger correction.
Bitcoin Price Prediction: Which Level Breaks First?
Bitcoin enters the FOMC announcement with no clear consensus from the technical indicators.
The short-term averages favor caution, ETF flows have weakened and Momentum and MACD are signaling recent downside pressure. Against that backdrop, the four-hour TD Sequential buy signal provides a potential reversal setup.
The key levels are relatively clear. Bitcoin needs to reclaim the $76,800-$78,000 area to improve its short-term structure. Above that zone, $81,430 and the low-$80,000s become the next technical references.
On the downside, $74,081 is the immediate pivot. A sustained move below it would bring $66,700-$70,000 into consideration.
The FOMC decision could produce an abrupt move through either side of this range, particularly as the market reacts not only to the interest-rate decision but also to the dot plot and Powell’s comments.
For the current BTC price prediction, the more meaningful signal may come after the initial FOMC volatility subsides. A sustained reclaim of the $78,000 area or a confirmed loss of $74,000 would provide considerably more information about Bitcoin’s next phase than a temporary intraday spike.

Julia Thornton is a cryptocurrency reporter covering blockchain, digital assets, and financial technology. She reports on market developments, regulation, exchange activity, and industry trends, delivering timely and accurate coverage of the global crypto ecosystem.
View all stories by Julia Thornton →