 BTC
 ETH
 USDT
 BNB
 XRP
 USDC
 SOL
 TRX
 FIGR_HELOC
 ZEC
 HYPE
 DOGE
 XMR
 USDS

Quant Price Analysis: QNT Explodes From $60 to Above $350 as Tokenized Banking Expands


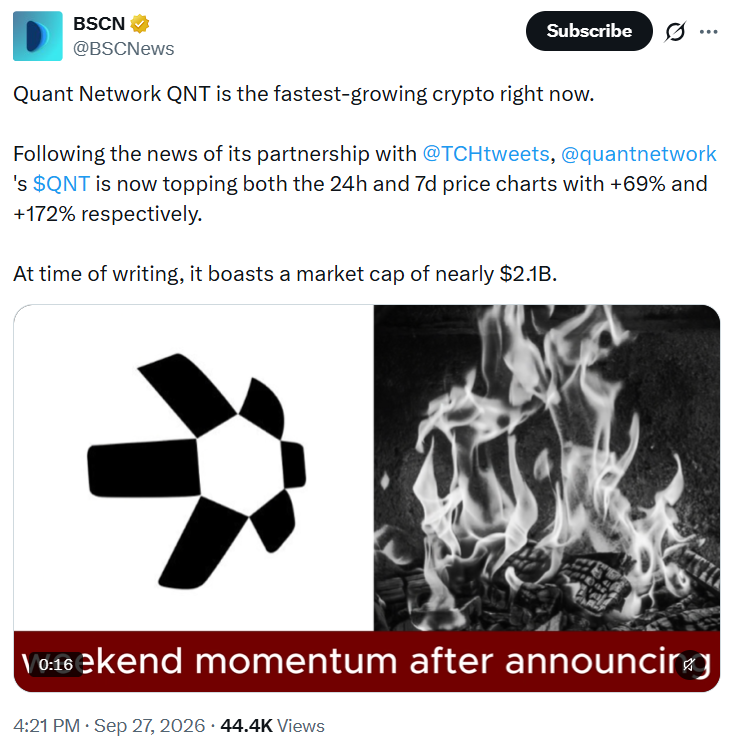
Quant (QNT) has emerged as one of the cryptocurrency market’s biggest movers after a sharp rally pushed the token from the $60-$75 range to above $350 within days.
The move followed a September 24 announcement from The Clearing House naming Quant as a technology provider for its On-Chain Money Initiative. The project focuses on using tokenized bank deposits within existing financial infrastructure, giving the rally a fundamental development alongside its unusually strong market momentum.
QNT’s rise has also been accompanied by a significant increase in trading activity and network usage. However, the token’s rapid appreciation has pushed several momentum indicators into stretched territory, leaving traders watching both the institutional development and the possibility of increased volatility.
Why Quant Suddenly Moved Into the Spotlight
The latest price surge was closely associated with developments in institutional blockchain infrastructure.
The Clearing House selected Quant to provide technology for its planned tokenized-deposit network. Quant is expected to handle interoperability and transaction coordination, allowing tokenized deposits to interact with established payment infrastructure.
The initiative is intended to connect blockchain-based money with existing systems rather than create an entirely separate banking network. The Clearing House plans to connect the project with its RTP and CHIPS payment systems.
The organization expects financial institutions to gain access to the network during the first half of 2027.
That timeline means the project is still in development. Nevertheless, the announcement gave the market a concrete example of Quant technology being considered for institutional financial infrastructure.
QNT Rally Leaves Earlier Trading Range Behind
Before the announcement, QNT was trading close to levels between $60 and $75. The cryptocurrency then moved through several price levels in rapid succession.
Historical market data shows QNT closing around $70.63 on September 24. The token advanced to approximately $90.12 the following day before reaching $151.69 on September 26.
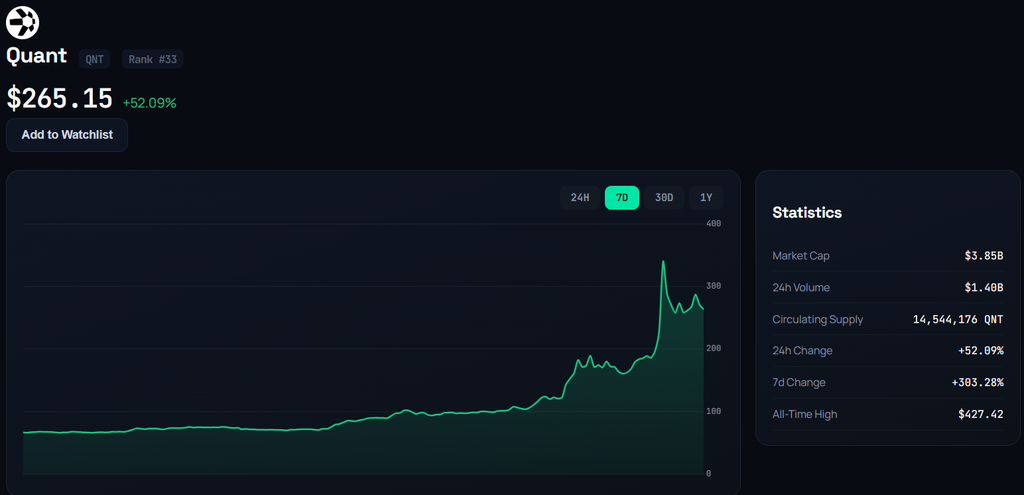
The most dramatic move came on September 27. QNT opened near $152.70 and climbed to an intraday high of approximately $353.48 before ending the session near $285.36.
That represented an 88.13% daily increase based on Investing.com data. Over the seven-day period, QNT’s gain exceeded 300% on several market feeds.
By September 28, the token had pulled back from its peak but remained substantially above its pre-rally range. One market tracker placed QNT near $267, with the 24-hour trading range stretching from approximately $158 to $358.
The large gap between intraday highs and lows illustrates how quickly market conditions have changed. QNT is now trading in an environment where individual sessions can produce extremely large percentage moves.
Institutional Tokenization Is the Bigger Story
The price action has drawn attention because Quant’s latest development involves a traditional financial infrastructure provider rather than a purely crypto-native company.
The Clearing House launched its broader On-Chain Money Initiative in June. The project is intended to explore how tokenized commercial bank deposits can operate with the speed and programmability associated with blockchain technology while remaining connected to existing payment infrastructure.
Potential applications include corporate treasury operations, cross-border payments, and capital-market transactions.
Sal Karakaplan, Chief Strategy Officer at The Clearing House, said, “Building interbank infrastructure for tokenized deposits requires proven technology that can scale.”
The Clearing House operates payment systems that process more than $2 trillion daily across several categories, including wire, ACH, and real-time payments. Its involvement gives the project an established banking infrastructure around which tokenized deposits can potentially be developed.
For Quant, the development provides a notable institutional use case for its interoperability technology.
QNT Token Demand Still Requires Careful Distinction
The banking announcement has naturally raised questions about whether institutional use of Quant’s technology could create additional demand for QNT.
However, the relationship is not direct based on the details publicly described in the announcement.
The Clearing House selected Quant’s technology for the initiative. The announcement does not state that participating banks must acquire QNT or use the cryptocurrency to settle transactions.
Quant’s documentation describes QNT as a utility token connected to its ecosystem and services. The company’s materials also identify uses, including staking and payment of certain platform fees.
As a result, the institutional adoption story and the investment case for the token remain separate questions. The banking project may increase attention around Quant’s technology without necessarily creating an equivalent amount of direct demand for QNT.
Network Activity Started Rising Before the News
Another notable element of the recent move is that activity on the Quant network increased before the Clearing House announcement.
Santiment data showed daily active addresses moving above 870 on September 16, exceeding a previous high of 792. New addresses also climbed to around 1.8 times their earlier average.
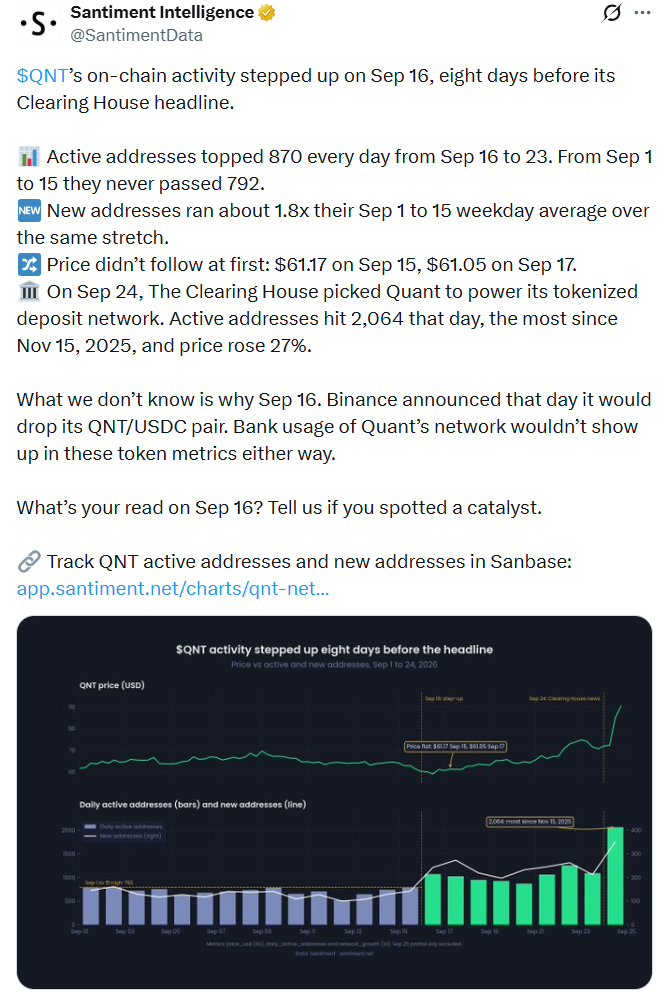
QNT, however, was still trading close to $61 at that point.
Activity increased further around the September 24 announcement. Santiment recorded 2,064 daily active addresses, described as the highest level in roughly 10 months, while QNT gained about 27% that day.
The data does not establish why activity increased before the announcement. Santiment also noted that the September 16 rise coincided with Binance removing the QNT/USDC trading pair.
That makes it difficult to identify a single explanation for the earlier network activity.
Technical Picture Changes After the Breakout
QNT’s technical structure has changed dramatically following the rally.
The token now trades well above its major moving averages on several timeframes. Recent readings show the 10-, 20-, 50-, 100-, and 200-period averages sitting below the current market price.
This is largely a consequence of the speed of the move. Longer-term indicators still reflect the months when QNT traded substantially lower.
Momentum indicators tell a different story.
Daily RSI readings across different market feeds have ranged from the mid-60s to above 90. Values above 70 are generally viewed as overbought, reflecting the intensity of recent price gains.
Other momentum tools, including the Stochastic and Commodity Channel Index, have also reached elevated levels on some daily charts.
The Average Directional Index has remained relatively high in several readings, indicating strong directional momentum.
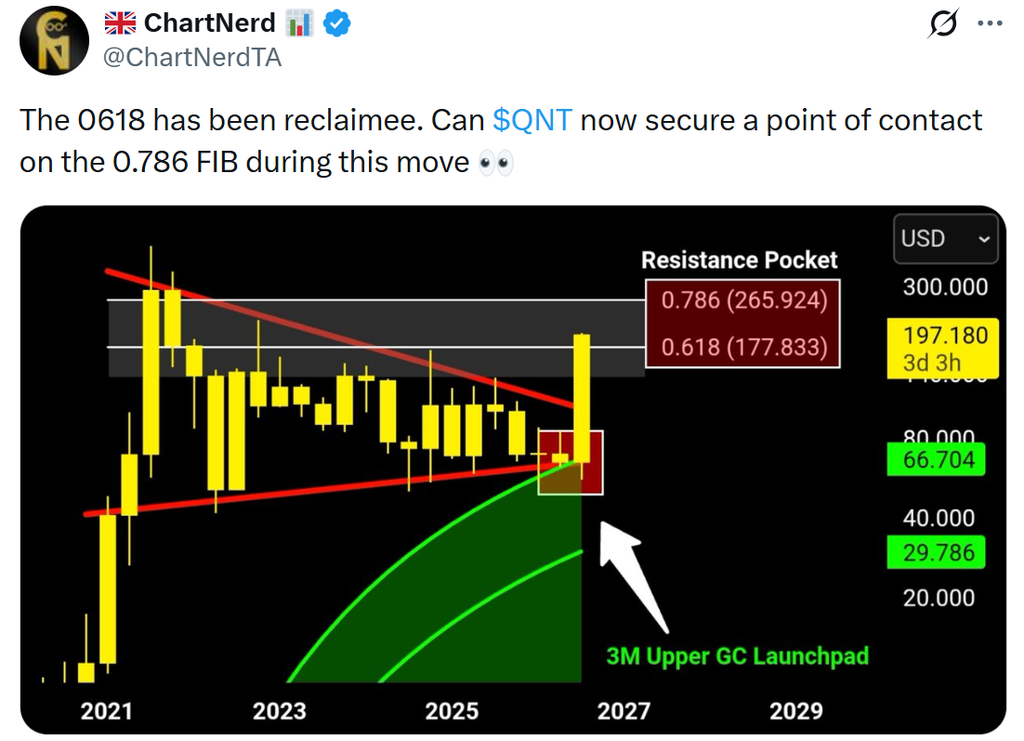
Technical analyst @ChartNerdTA identified approximately $178 as the 0.618 Fibonacci level. The analyst noted that QNT had reclaimed that area after previously facing resistance between approximately $177 and $265.
The next Fibonacci reference highlighted was near $266, corresponding to the 0.786 level.
$260-$270 Becomes an Important QNT Reference Zone
The mid-$260s have gained importance following the latest price movement.
Recent pivot calculations place the broader $260-$270 area near a key short-term reference zone. Above it, potential resistance appears around $275-$285, followed by the $285-$300 region.
The September 27 high near $353 represents a much higher reference point. Other market feeds also recorded QNT prices above $350 during the rally.
If the token experiences a deeper correction, technical calculations point toward approximately $230 as another Fibonacci reference. The $195-$200 region represents the 50% retracement area of the broader move.
These levels should be viewed as technical markers rather than predetermined turning points. QNT’s recent trading range has been exceptionally wide, increasing the possibility of rapid moves through individual support and resistance zones.
What Comes Next for Quant?
Quant now sits at the intersection of two very different developments: a rapidly expanding cryptocurrency market valuation and a longer-term institutional project that is still being developed.
The Clearing House expects its tokenized-deposit network to become available to financial institutions during the first half of 2027. Quant’s technology is expected to provide an important interoperability function within that infrastructure.
For the QNT market, the immediate question is whether the token can maintain a meaningful portion of its recent gains after rising several hundred percent in a matter of days.
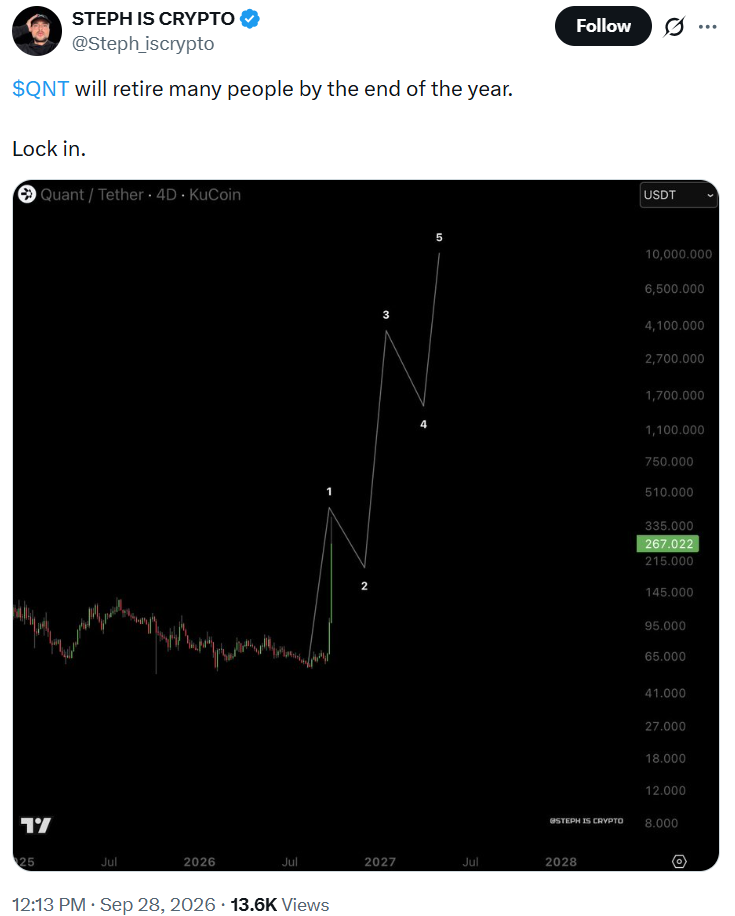
The technical picture shows strong upward momentum, but the elevated RSI and other oscillator readings also demonstrate how extended the move has become.
The $260-$270 area is likely to remain an important technical reference following the pullback from the September high, while $230 and $195-$200 provide deeper retracement levels.
Ultimately, the longer-term significance of the latest rally will depend not only on market momentum but also on the development and eventual use of the institutional tokenization infrastructure now being built around Quant.

Jack Spencer is a financial journalist and crypto market analyst covering digital assets, blockchain innovation, and global market developments. His reporting focuses on cryptocurrency price trends, regulation, institutional adoption, and the evolving digital asset ecosystem.
View all stories by Jack Spancer →